

Introduction
Only 1 in 6 procurement or finance leaders regularly present meaningful performance metrics, restricting their strategic impact.
Why? Largely because they struggle to access the data. But often because they are simply focusing on the wrong metrics in the first place.
See the 11 key metrics the most strategically-impactful procurement leaders rely on every day, and why.
THE USUAL
Budget vs spend
Spend per department
Spend by category
Completed vs inflight spend
Open, complete and overdue requests
Upcoming expiring contracts
Supplier payment compliance
Supplier risk data
Last contract spend
Tool usage (software-specific)
All of these metrics are valuable - they drive individual cost-saving initiatives and optimize particular tasks or departmental goals.
But they are not enough.
They alone do not equip procurement to be genuinely strategic. They neither give procurement the information they need to make the right decisions, nor show procurement’s overall value to other stakeholders.
Akin to cracking open a clam shell to reveal a pearl, you must look beyond the face value of a piece of data to find the real value.
Given that companies with the most advanced procurement processes and reporting are 32% more innovative and 29% faster to market with new products and services, but only 1 in 6 procurement teams have achieved this, the majority of procurement leaders need to up their game in the metrics they rely on.

THE UNUSUAL
Approval times per function
Difference between time to complete renewals vs new purchases
Difference between time to complete renewals vs new purchases
Difference between time to complete renewals vs new purchases
Difference between time to complete renewals vs new purchases
Difference between time to complete renewals vs new purchases
Difference between time to complete renewals vs new purchases
Difference between time to complete renewals vs new purchases
Difference between time to complete renewals vs new purchases
Difference between time to complete renewals vs new purchases
1. Approval times per function
Time to Approve by Department (Days)
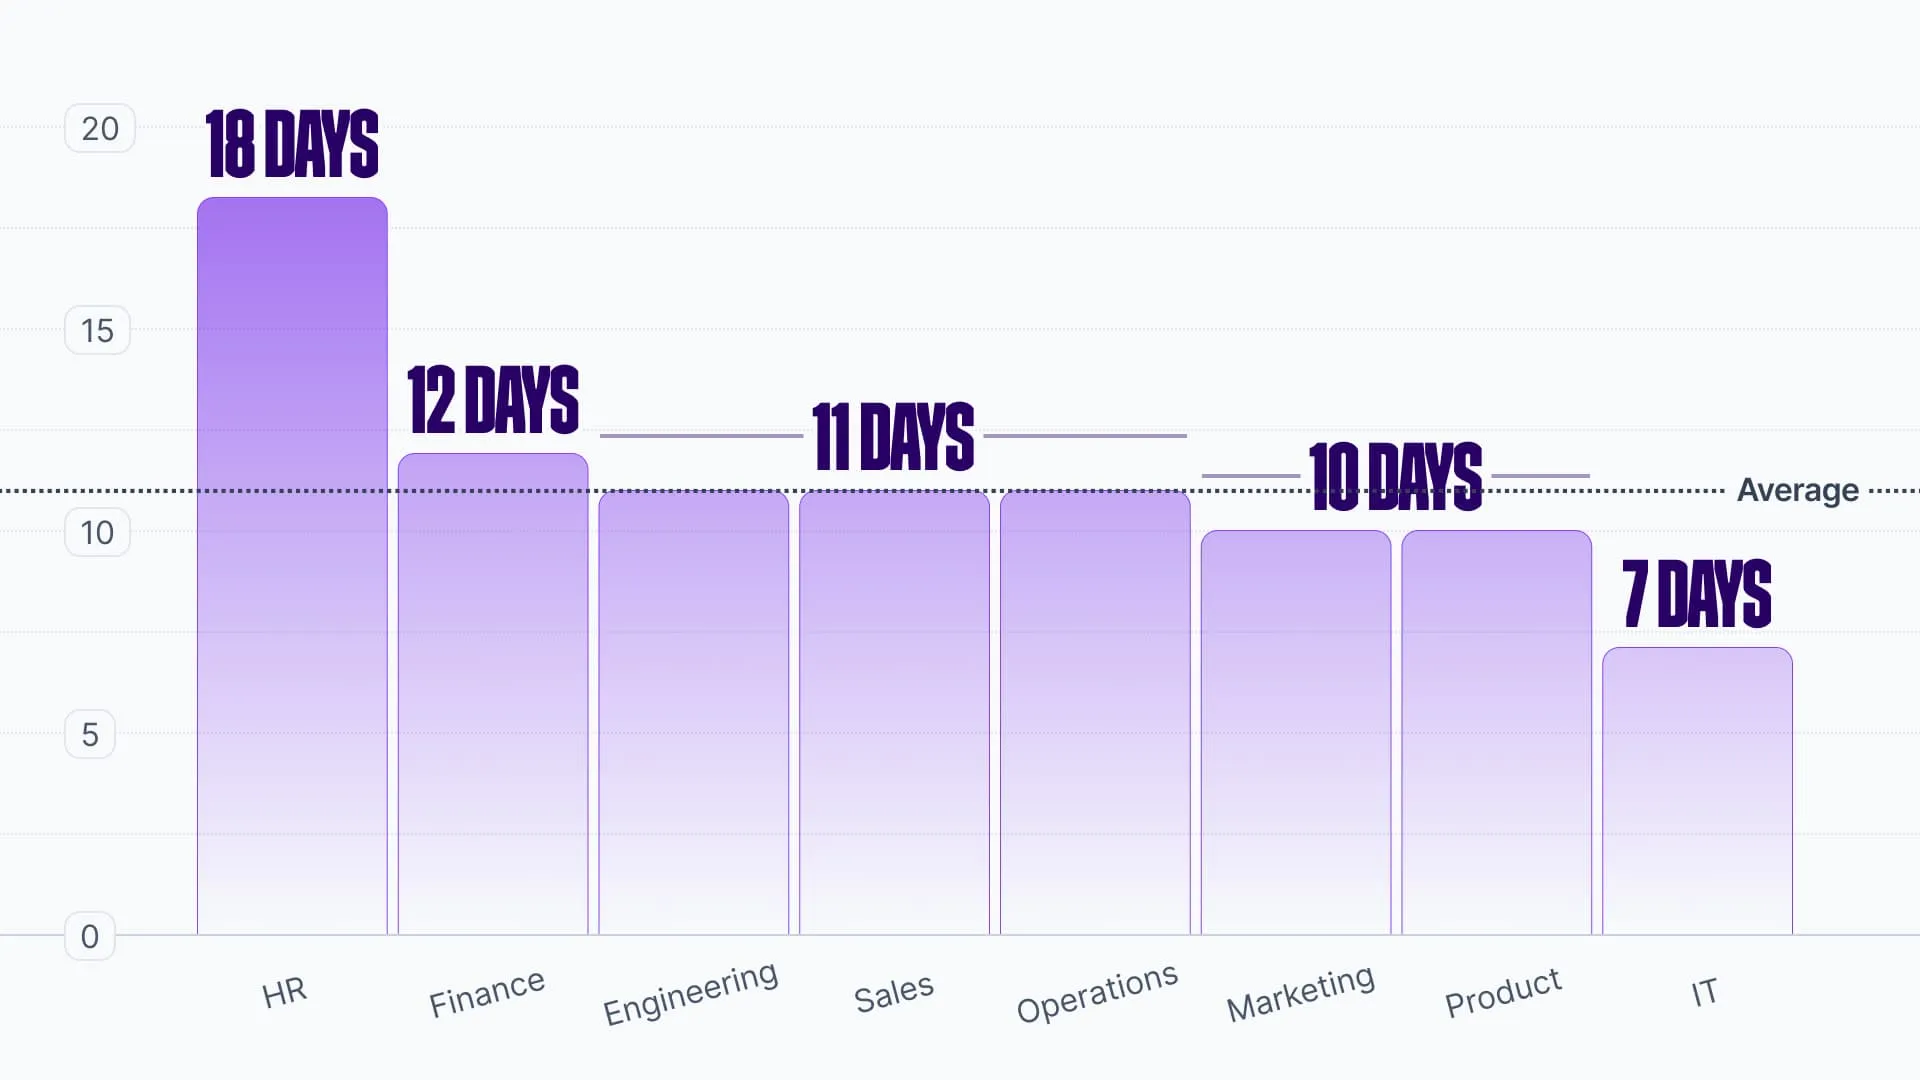
How long each team or stakeholder takes to approve a contract.
Certain departments or individuals may be ‘repeat offenders’ for delaying purchases with slow approvals.
Sometimes, this metric reveals stakeholders may simply need to better prioritize procurement requests.
But drilling into when these stakeholders are slowest may identify issues with the process itself. Stakeholders may be being asked for their sign-off too late, too early, without the right information, in the wrong circumstances etc.
Fix these problems and approval speed increases, but so does the ease - and internal reputation - of procurement.
2. Difference between time to complete renewals vs new purchases

How long a renewal typically takes to complete, and how long to complete a new purchase request.
Both have individual criteria and so require different processes and routing, which affects time spent in a procurement process - and may highlight over-complications or over-simplifications in the processes themselves.
You can mould your procurement processes, policies and communications to match. For instance, procurement requires X amount of time for a typical renewal, and perhaps 2X time for a new purchase.
But this metric also helps you plan your team’s capacity. By understanding the time difference per type of request, and analyzing this contextually with company growth plans and budgets, procurement leaders can quickly ascertain whether the current team’s size or approach is fit for purpose.
3. Industry-specific and tiered vendor benchmarking
Typical SaaS tool spend breakdown for financial services (%)
.webp)
Comparative benchmarks on your vendors, filtered by industry and company size.
Businesses should compare their supplier choices, service packages, features, contract terms and price only with those with the same requirements.
Make the most informed decisions by comparing yourself to those in the same situation. Ecommerce retailers, for example, have very different requirements of their email tools than most other industry sectors, making generic benchmarks almost useless.
Similarly, tailored benchmarks show companies when their suppliers are unusual compared to their peers. For example, knowing when your peers have typically outgrown certain tools and have switched can help when scrutinizing requests for strategic value.
4. Majority spend suppliers
Number of Suppliers vs Proportion of Spend
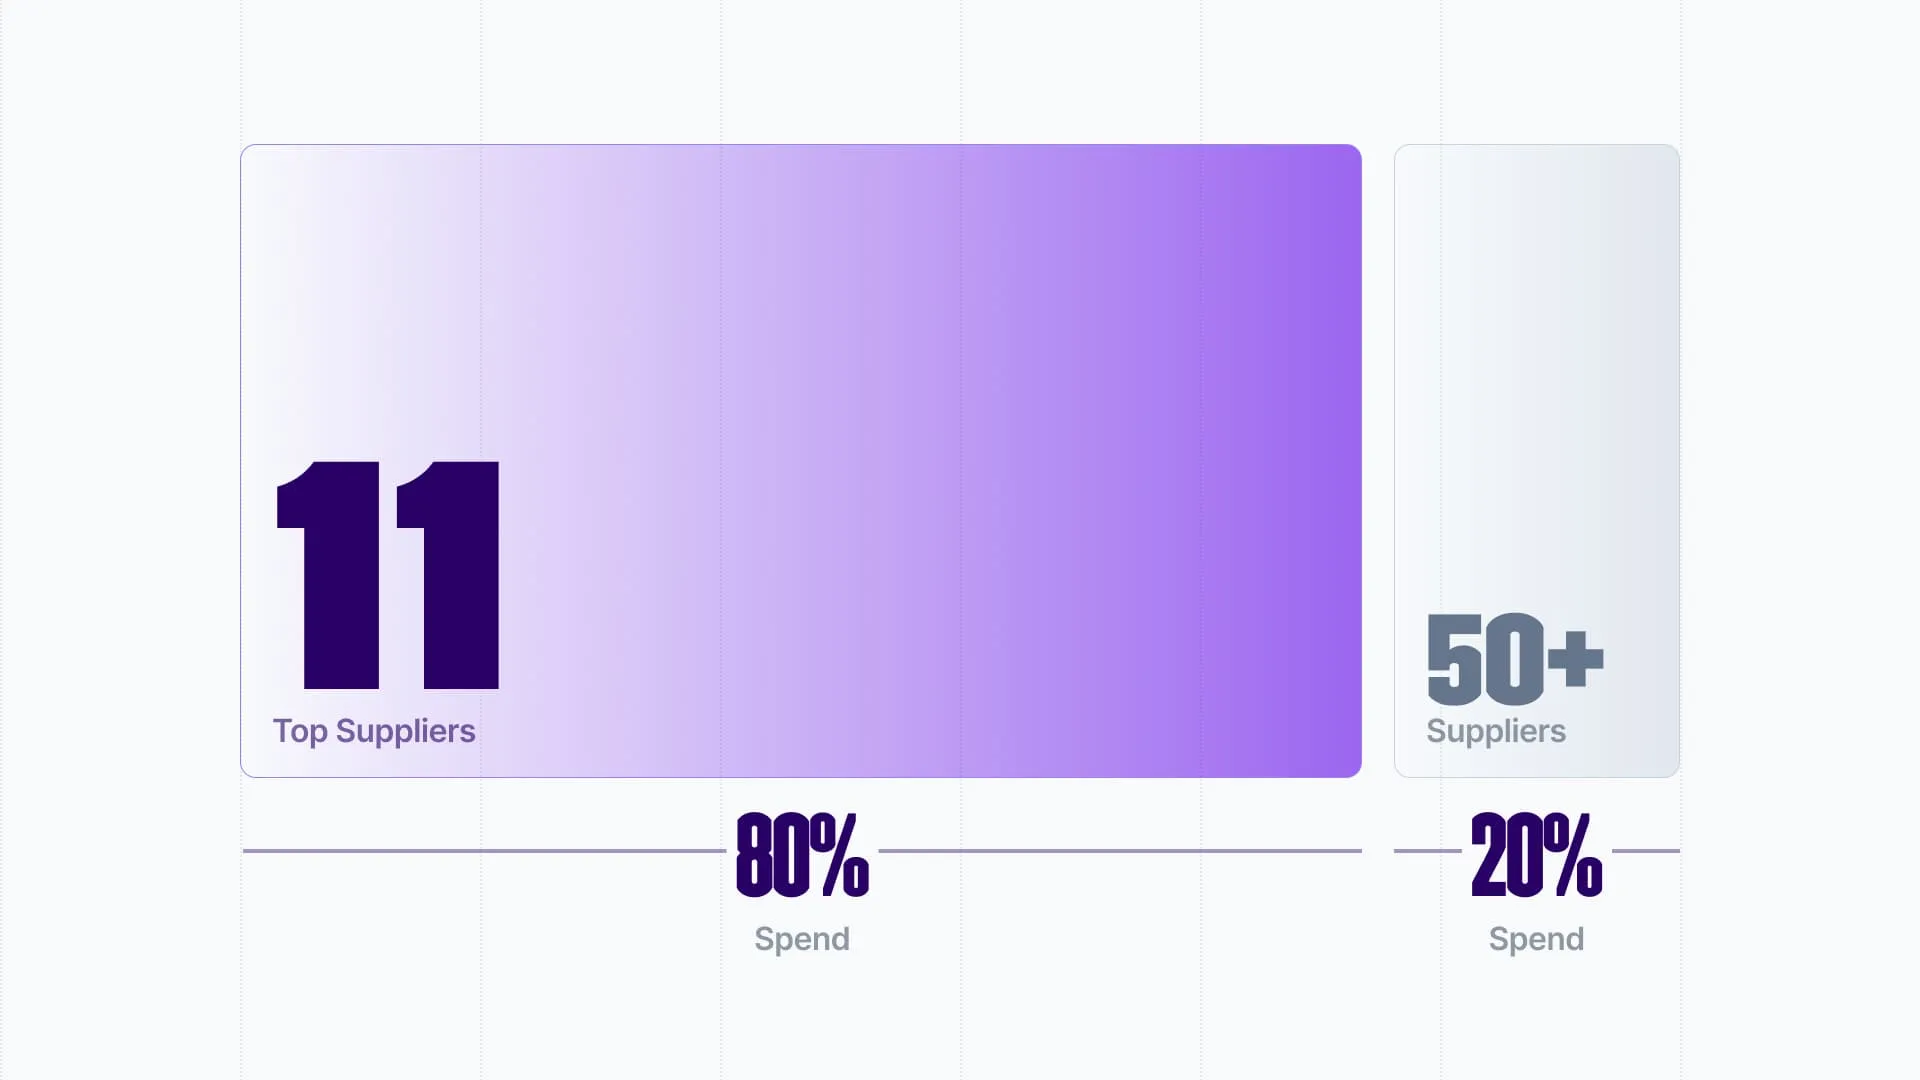
The suppliers that account for the largest proportion of your spend.
As per the Pareto Principle, 80% of your costs will likely come from only 20% of your suppliers, or even fewer.
Many of the businesses we work with find surprise inclusions in their majority spend suppliers - vendors that they didn’t realize they spent so much with or were so reliant on.
Top-value suppliers' selection, costs, performance and terms should be scrutinized the most, and whose renewals you examine and benchmark most closely. Deliver maximum strategic benefit by creating a close, productive, cost-efficient working relationship.
5. Maverick spend
Average Non-Compliant Spend vs Top Non-Compliant Spend Departments (%)
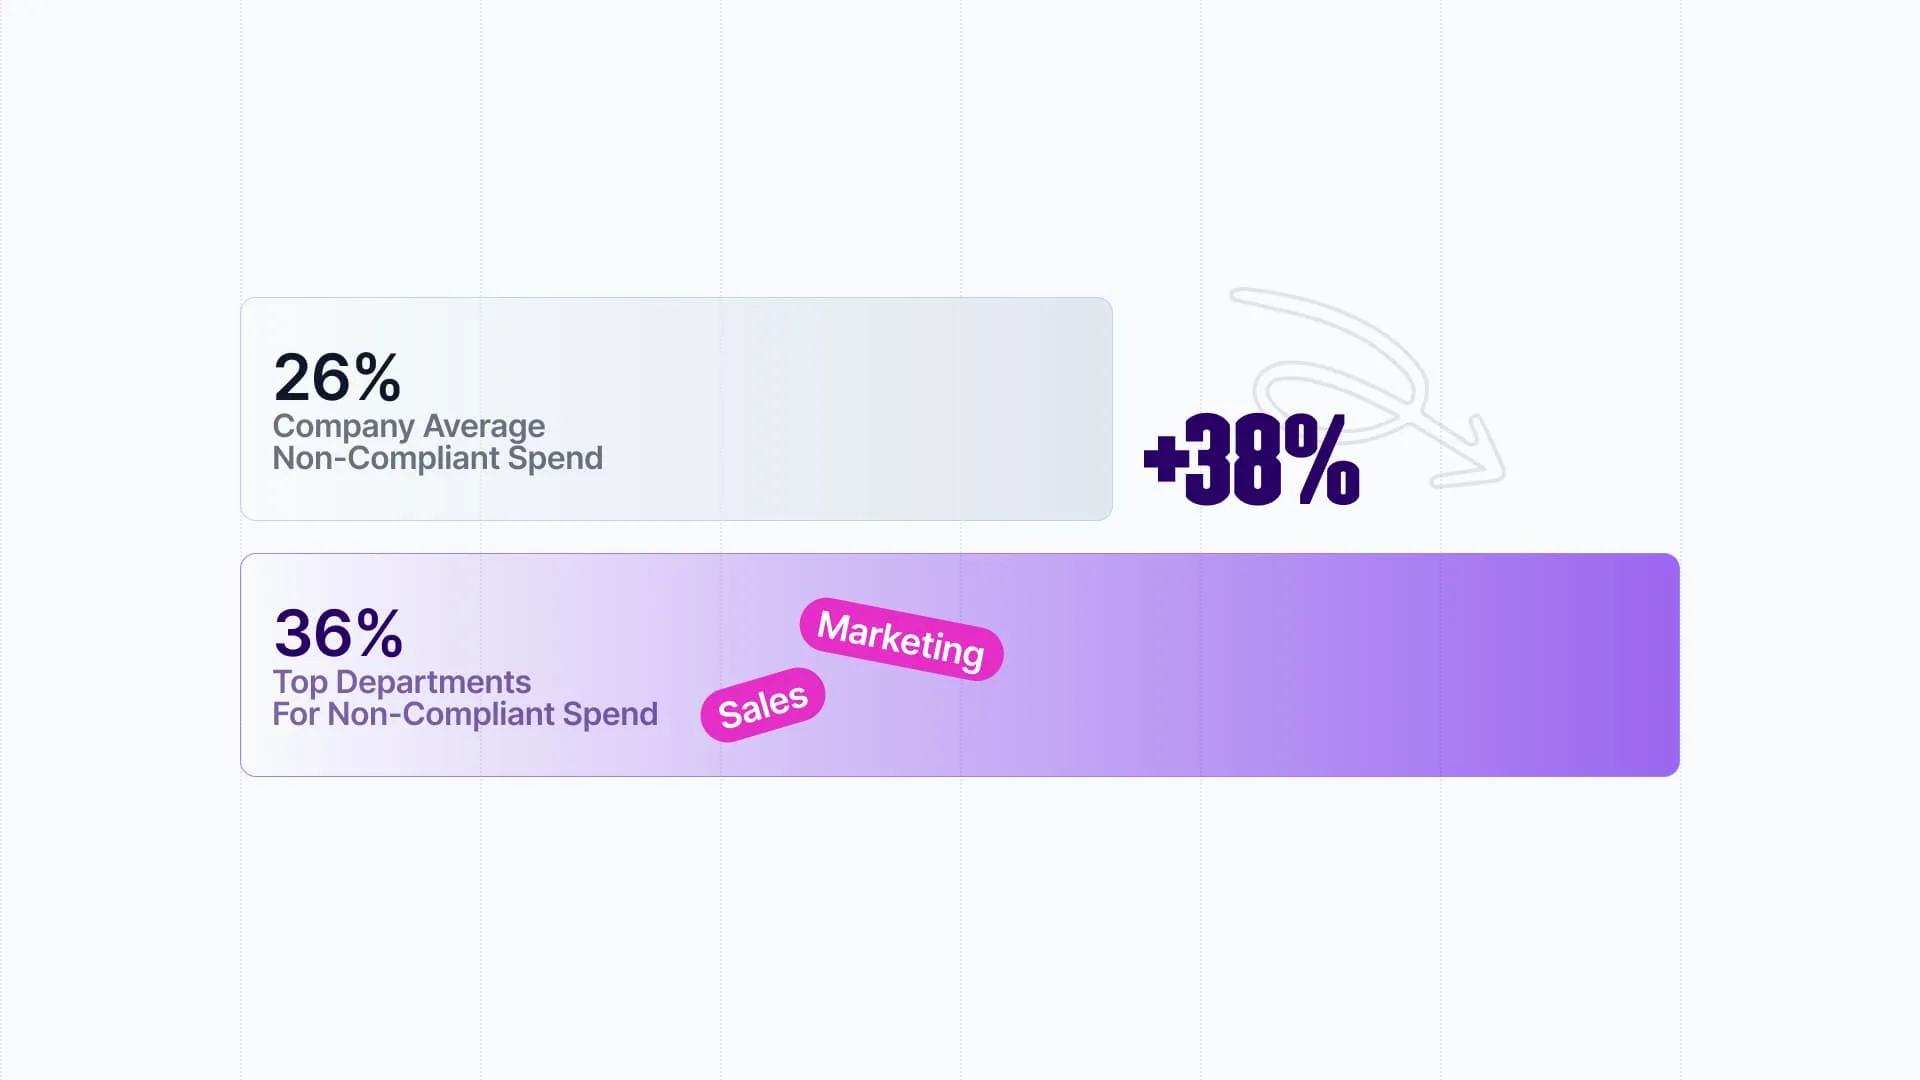
The amount of spend that goes outside formal procurement workflows.
Anything being spent outside of official procurement channels has not passed financial, compliance or business requirements checks, and the subsequent spend is not being tracked for budgeting and cash flow control.
Mitigating the material impact of runaway costs, reducing the percentage, or bringing notorious rogue departments back into the fold is how procurement leaders show value.
Solutions may range from policies and education to streamlining the intake and procurement workflow, making official processes easier to follow.
6. Procurement requests completed and time spent per request
Number of Procurement Events Completed per Year
.webp)
The volume and sustainability of procurement activity, and how speed of procurement is changing.
For most businesses, speed is everything. But this is only useful when viewed in context of the amount of activity. This metric will highlight when a procurement team is reaching capacity; how new initiatives have impacted speed of performance; and how efficient procurement is.
This can benchmark whether the team can facilitate company growth strategies by coping with demand, or become a bottleneck due to lack of resources or capabilities.
You can also use this to dig into each stage of the procurement process to find efficiency opportunities, thereby increasing the number of requests you can fulfil and improving the stakeholder’s experience. Both add more value to the business.
7. Procurement ROI
Measured Procurement ROI vs FTE Salary ($)
.webp)
A classic and vital calculation of the value delivered by the procurement team versus its cost.
The main argument for this metric is obvious, especially as it defeats the stigma of procurement being a cost center rather than a value driver. It also serves as a core ‘North Star’ metric for overall departmental improvement.
Highest performers track this over time to not only prove value but justify further investment in the department, support talent development, investigate inefficiencies in processes and workflows, and set data-driven goals such as reducing turnaround times or improving supplier relationships.
8. Requests outstanding
On-Time Requests vs Overdue Requests

The percentage of requests remaining open past their deadlines
It reveals how efficient and reliable - or not - your entire procurement process is.
When showing a negative picture, this metric should trigger a great deal of additional investigation. You need to ascertain whether this is a problem of scale and resource, individuals and their approvals, or the overall process - and then act upon it rapidly.
9. RFP turn around times (preparation to vendor selection)
.webp)
The time taken between problem identification and vendor selection, including preparing the RFP and defining requirements, and receiving and evaluating responses.
Vendor selection through formal RFPs can be the most arduous, resource-intensive and lengthy of procurement processes. Efficient management can not only increase speed to purchase and drive efficiency, but also improve procurement’s internal standing.
Understanding each of the stages in detail allows you to find opportunities to improve overall speed.
However the end goal is not just speed: the knock-on effects are massively strategic. Supplier relationships improve, you're in a stronger negotiation position, costs reduce, and you can seize a competitive advantage by deploying innovations faster.
10. Spend under management
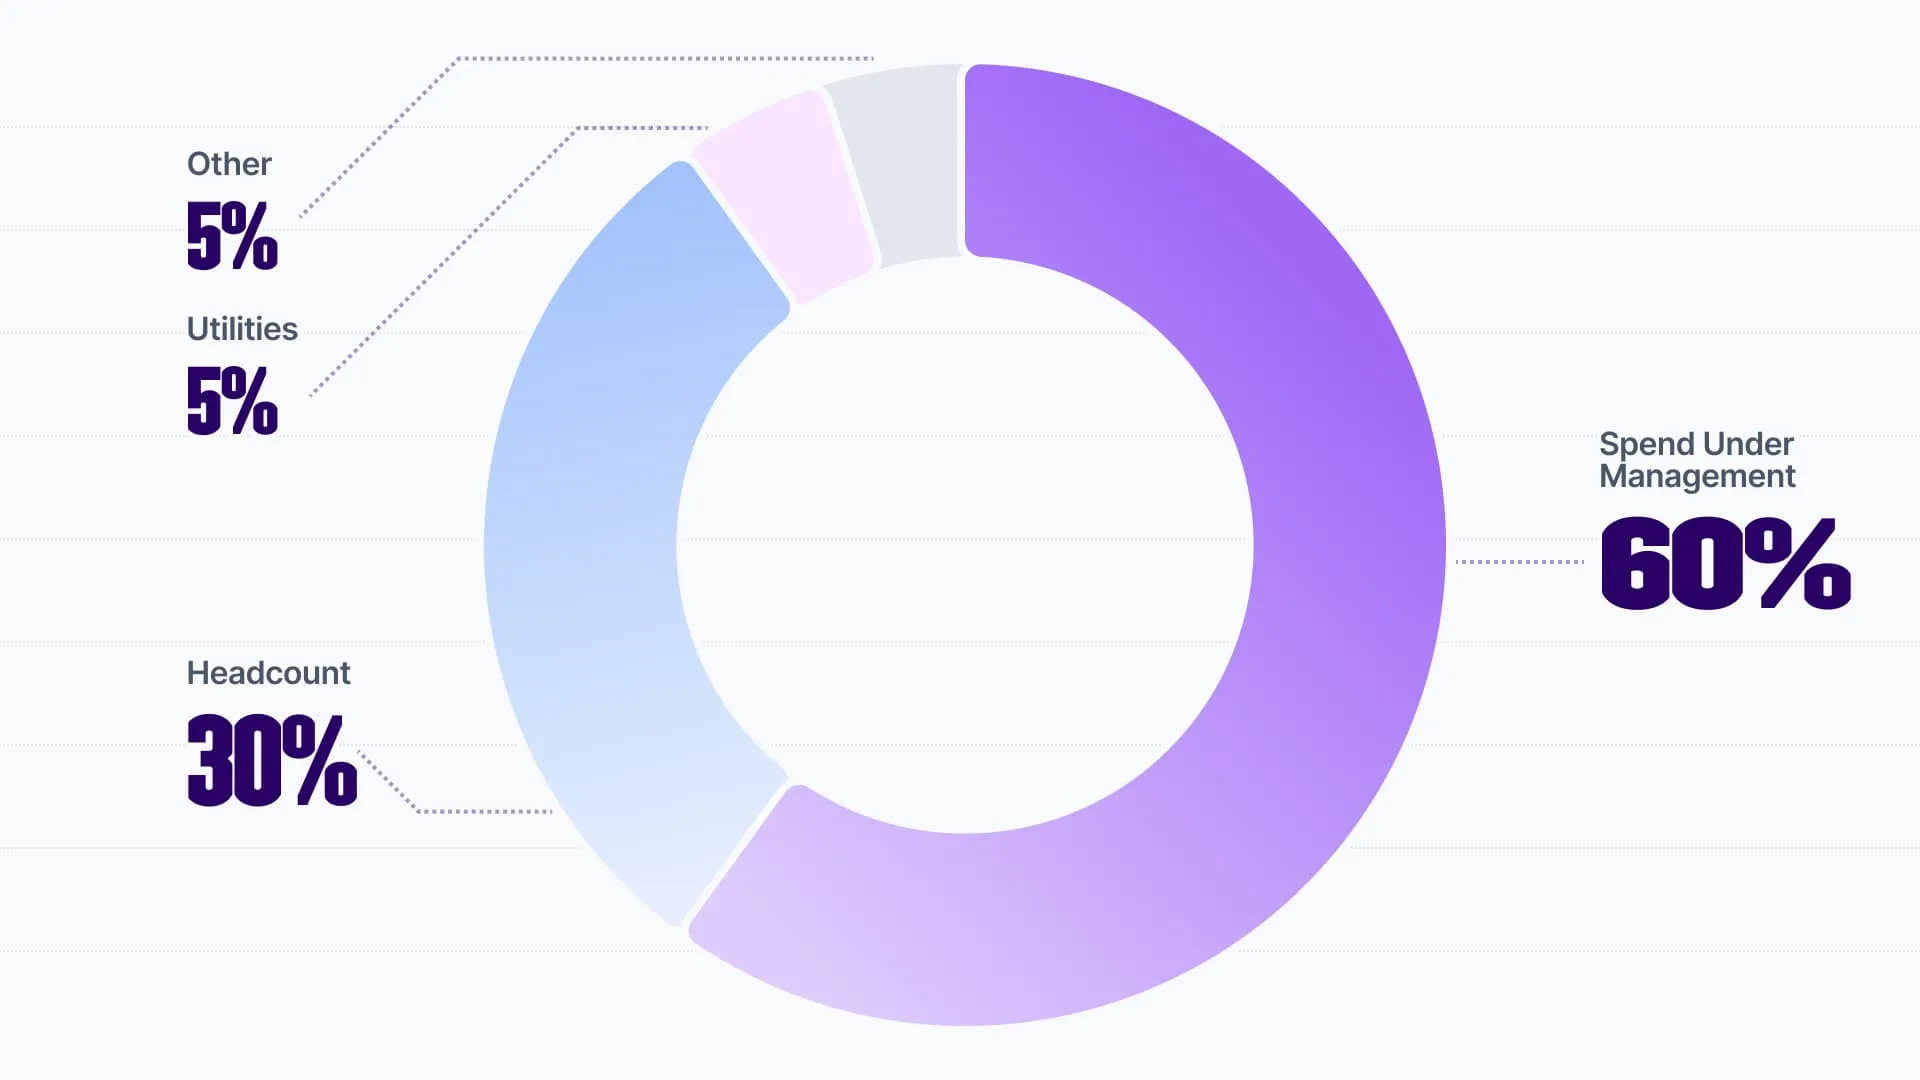
The proportion and value of the company’s overall spend that is actively managed by the procurement team.
The higher the proportion of procurement spend under management, the greater control the business can assume it has over spending, compliance, efficiency and value creation.
Showing an upward trend is clear evidence of procurement’s strategic value in the business. It also shows how well-adopted its processes are, and is an indirect measure of its internal reputation.
11. Supplier compliance rates
Vendor ISO 27001 vs SOC2 certifications (%)
.webp)
The percentage of vendors who possess the certifications you require, for example ISO 27001 or SOC2.
Avoid regulatory penalties by ensuring your supply chain and vendors do not undermine your compliance with security, data privacy or procedural frameworks.
Many businesses also need to evidence their compliance before their customers are able to work with them.
This ensures that compliance requirements are part of the procurement intake, and suitable approvals are placed in the workflow at the appropriate point.
It also draws notice to when suppliers suddenly lose accreditations, or helps you make strategic recommendations to change vendors.
Tangential metrics
The metrics above are objective measures derived from procurement data. But in our analysis, we noticed the top performing procurement teams also use more non-traditional metrics:
Procurement teams should regularly check in with internal stakeholders and the suppliers themselves to take on constructive feedback, and adapt and evolve the function’s performance and service offerings.
This feedback is then translated into a measurable, trackable metric.
The best performing procurement teams are highly transparent. Tracking and logging lost procurement opportunities to the business (potential savings, cost avoidance, maverick spend that didn’t need to be outside the procurement process etc) can help inform changes to workflows and intake.
Aside from the ethical drivers of ESG initiatives, many businesses attribute commercial value to their ESG credentials. They need them to score highly in selection processes with their own customer base.
Top procurement teams therefore show their strategic value by evidencing how their supply chain decisions are contributing not only to the business’ overall carbon reduction targets, but also its commercial opportunities.
A sign of a healthy team is high performance and low staff turnover. Procurement leaders should partner with HR to ensure retention / career progress plans are developed for the team and tracked accordingly.
“Procurement’s role has shifted from traditional cost savings and operational efficiency teams to a function that adds greater ‘value’ throughout the business across multiple facets.
Mature, forward-thinking procurement teams will look for broader ways to create value with greater focus on ROI, Compliance, Risk, ESG, and simplifying the procurement experience for end users (via technology) and talent retention (including attracting new talent).”

Accessing and presenting all these metrics is notoriously difficult.
It is not uncommon for each one of these metrics to be measured on its own different platform or from disparate datasets. And for many, these metrics aren’t - or can't be - measured at all.
But all these metrics have one thing in common: they are measures of your workflows and/or the transactions going through them.
Which means, all these metrics can be easily accessed, reported on and improved if your procurement workflow and orchestration platform is:
Otherwise, the only way to access and measure these metrics is through manual data wrangling or expensive third-party analytics tools and even data warehouses.
Intelligent Workflows
In-workflow insights plus streamlined and frictionless purchasing
Intelligent Workflows is the only procurement orchestration tool to also provide deep insight into procurement performance, and deliver savings guarantees.
With Intelligent Workflows, you get:


.webp)


